S.A.M. User Instructions
Meet S.A.M.! A brand new (and free-to-use) user-friendly, digital stakeholder analysis and mapping tool for creating simple and digestible visuals of the interrelationships between all types of stakeholders in clean energy and infrastructure project landscapes.
How to use S.A.M.:
Notes: S.A.M.’s interface has been designed to promote accessibility and maximize user-friendliness. To provide feedback on any aspects of S.A.M.’s usability, please write to us at hadia.sheerazi@rmi.org. We thank you for your feedback!
STEP 1:
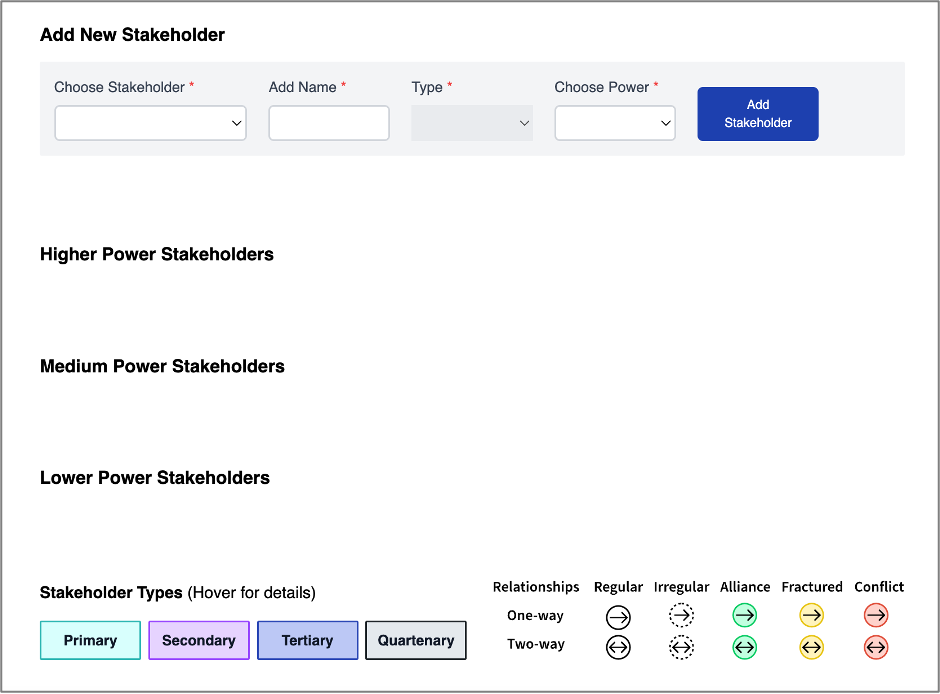
Start with the “Add New Stakeholder” feature on top of the webpage (screenshot below).
Begin by selecting the dropdown “Choose Stakeholder,” and select from one of the 33 different stakeholder categories that apply to your project’s landscape (choose “Other” if you don’t see the specific category you’d like to add).
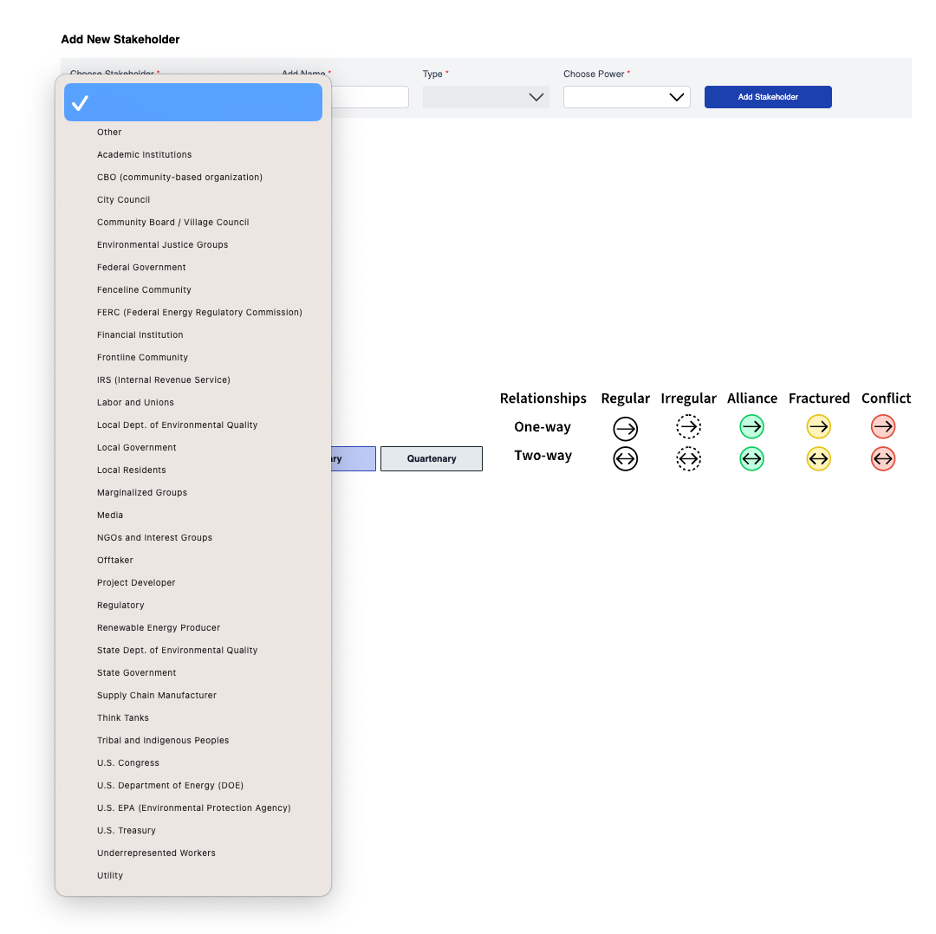
For example, if you select “NGOs and Interest Groups,” the tool will display this result:
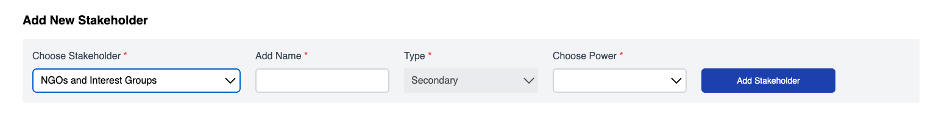
Common categories of stakeholders are preset as one of the four most common “Types” — primary, secondary, tertiary, and quaternary (please see below for the assumptions behind the preset categories):
Primary stakeholders can be individuals or organizations who are most affected by the project and/or may be the most influential player(s); they typically have the greatest dependency on the resource in question, and/or are the most affected by the outcome of the project (i.e., the project affects their livelihoods or quality of life).
Examples: low income and/or minority residents; labor unions and non-unionized workers; project developers
Secondary stakeholders can be individuals or organizations that would be more indirectly or less affected by the outcome of the project; (i.e., project does not affect their basic livelihoods or quality of life); they may be able to influence or be influenced by the project.
Examples: community-organizations; faith-based organizations; NGOs; economic development agencies (EDAs); industry interest groups
Tertiary stakeholders external stakeholders, individuals or organizations, who will be impacted the least; they may have an interest in the success or failure of the outcome of the project.
Examples: federal, state, local governments and policymakers; regulators (FERC, public utility commissions (PUCs))
Quaternary stakeholders can be individuals or organizations who have no direct impact on the project but may be interested in the success or failure of the project.
Examples: media; academic institutions; think tanks
STEP 2:
You can customize the name of all your stakeholder(s) by adding unique names or identifiers in the text box to the right of “Choose Stakeholder.”
For example, you can enter “RMI” as the name of this stakeholder:
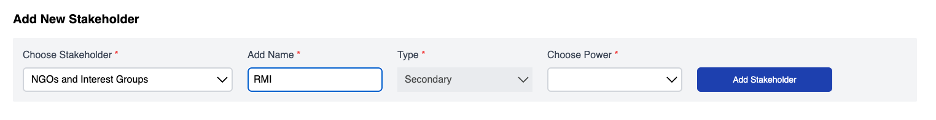
Pro Tip: You can easily edit or re-write the name of the stakeholders at any stage.
STEP 3:
Next, after analyzing the (relative) impact of each stakeholder in the local and historical context of the community, as well as in the context of the role (if any) they have in the potential project (i.e., the degree to which they can influence the success or failure of the project), you can select one of the three options in the drop-down: “Higher,” “Medium,” or “Lower,” to “Choose Impact,” for each stakeholder you’ve identified in the project’s landscape:
For example, in this particular project’s context, “RMI” has “Medium” impact given the Institute’s technical expertise on the deployment of clean hydrogen for industrial decarbonization:
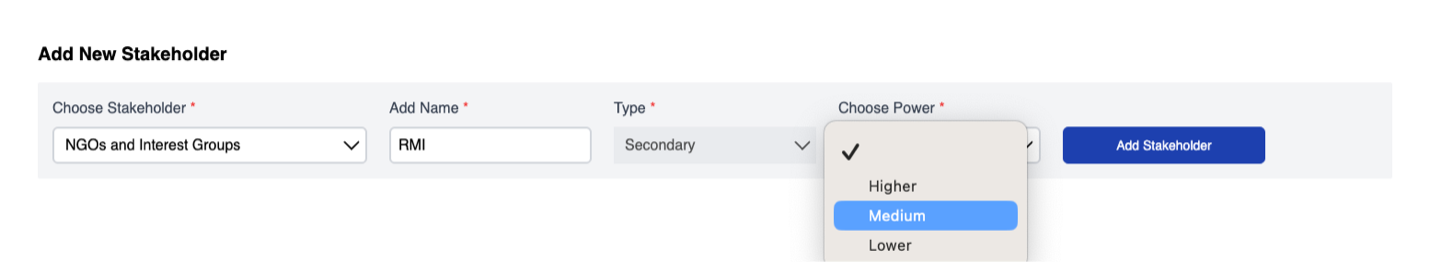
Pro Tip: To determine each stakeholder’s respective power, consider where they fall on the spectrum between high and lower impact groups. If they are somewhere in between the two, select “medium” impact:
High impact: these stakeholders or individuals typically possess resources or have the ability to exert control resources or recognition (e.g., money, assets, information, food, appreciation) that others, especially lower impact groups (LPGs), depend on; and in some cases, lower-impact groups expect high-impact groups (HPGs) to provide such control.
High-impact groups will tend to possess greater ability to modify another group’s status or access to resources or recognition. They enjoy relative freedom to interact with others as they wish while maintaining independence from them and they tend to possess greater resources and socio-economic power within a community.
Typical examples of high-impact groups: elected officials, government agencies, project developers, unionized labor, regulators, investors and financiers, etc.
Lower impact: stakeholders or individuals in some gorups can possess less resources and recognition (e.g., money, assets, information, access to food, appreciation) and have lower control over resources, and greater resource dependency on high impact groups, and thus may have a lower impact on outcomes.
They could also have limited access to resources and/or face more social constraints; lower-impact groups may also sometimes act in self-preservation (e.g., taking care not to antagonize a group with more power).
These groups can include: energy communities; Tribal and Indigenous nations; low-income and minority communities; non-unionized labor; disabled persons; the elderly; children and youth, etc.
Pro Tip: CONTEXT MATTERS! In some communities, a frontline or fenceline community (historically, commonly a lower-impact group) may possess higher impact in contexts where their lack of support or approval of a project (e.g., opposition via protests or objections in public hearings or public comment filings) could prevent the issuance of permit or delay construction, leading to project delays or even cancellations.
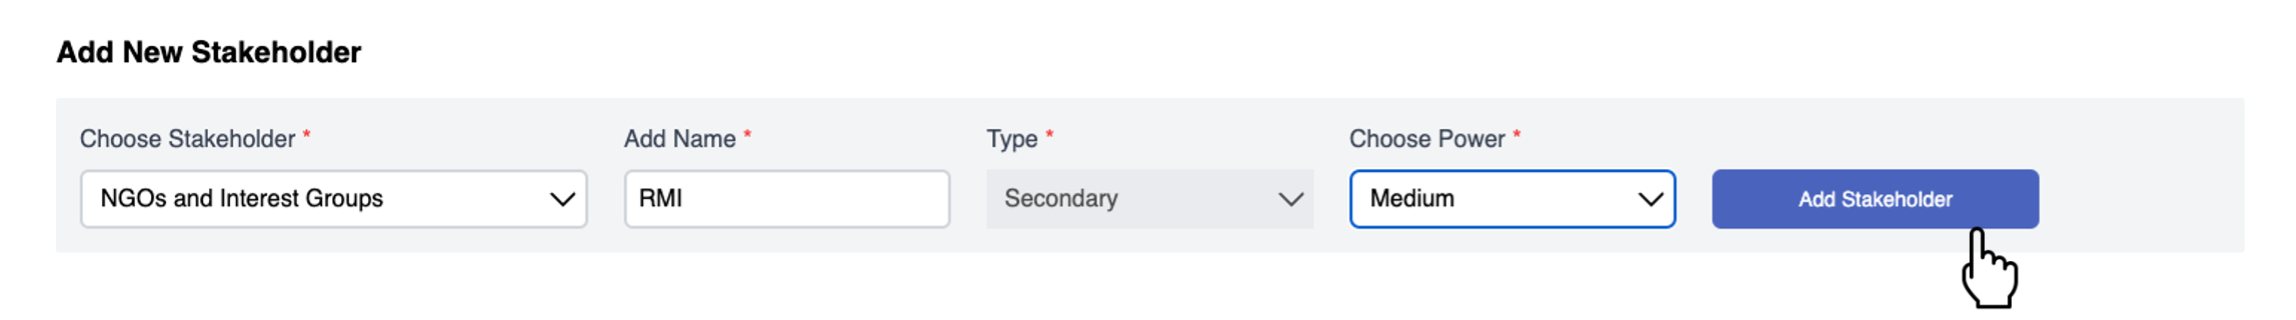
Finally, click on the “Add Stakeholder” button to add your entry:
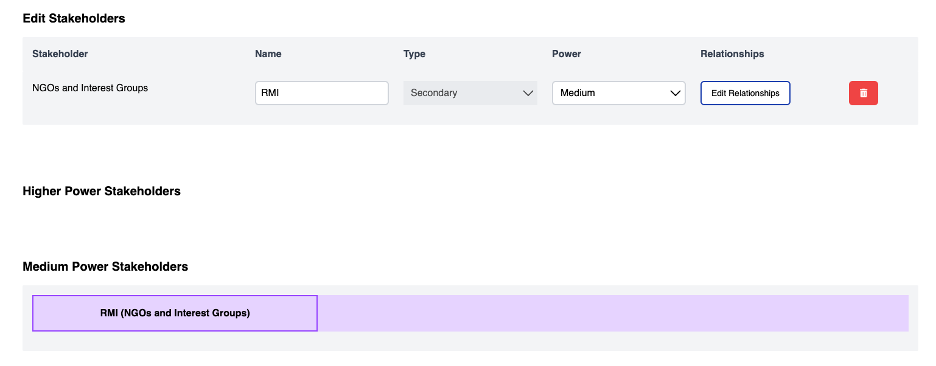
The tool will automatically sort “RMI (NGOs and Interest Groups)” under the Medium Impact Stakeholders category of S.A.M.’s interface:
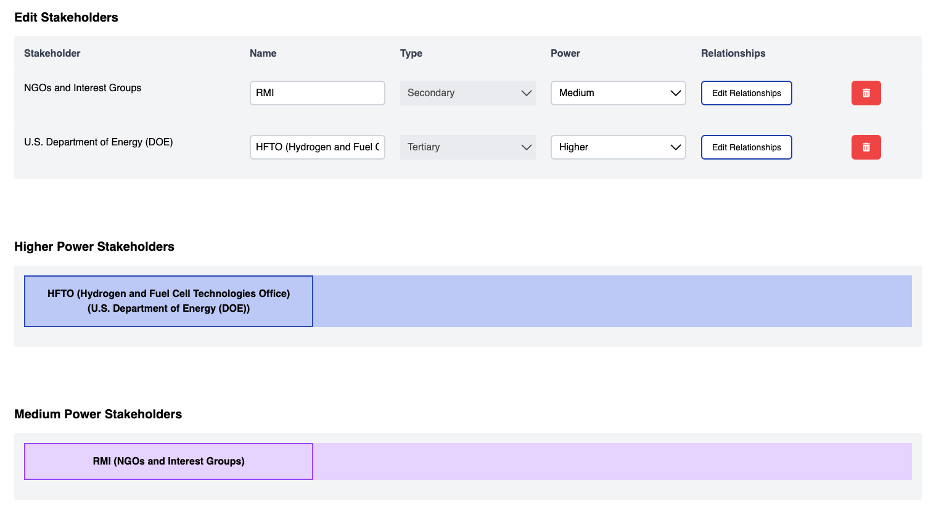
Before you can proceed to analyze interrelationships, we recommend adding all (or as many of) the stakeholders you’ve identified through desk research (census data, digital media, newspaper articles, etc.), reviewing public hearing records, interviews with key stakeholder groups (e.g., residents, community organizations, organized labor and non-unionized labor, faith-based groups, economic development organizations, etc.). At a minimum, you will need to add at least two stakeholders to be able to begin visualizing interrelationships using the S.A.M. tool.
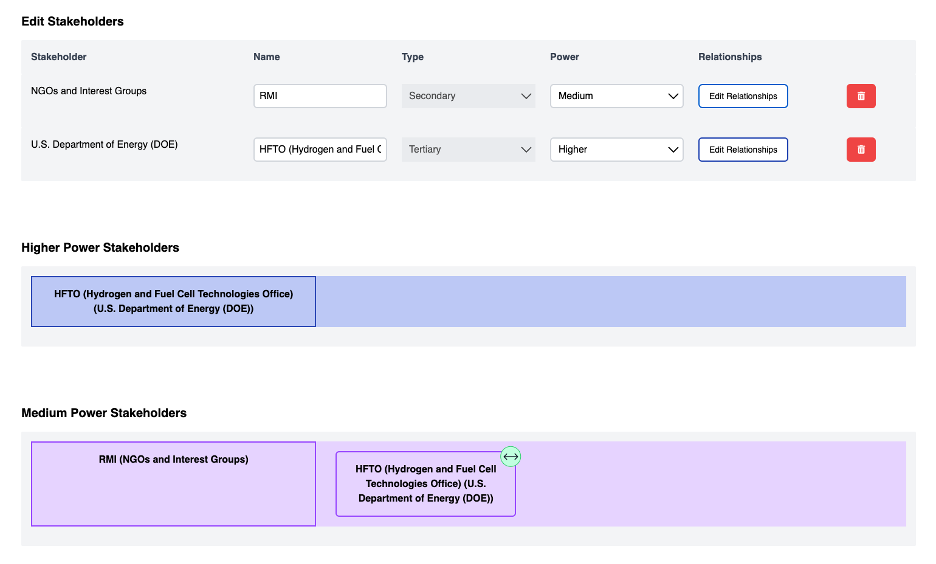
For example, we’ve added a second stakeholder “HFTO (Hydrogen and Fuel Cell Technologies Office)” following STEPS 1, 2, and 3 above:
STEP 4:
Next, we’ll analyze the interrelationship between these two stakeholders. Go to the “Edit Stakeholders” section of S.A.M., and click on the “Edit Relationships” button to the right of the first stakeholder, “RMI:”
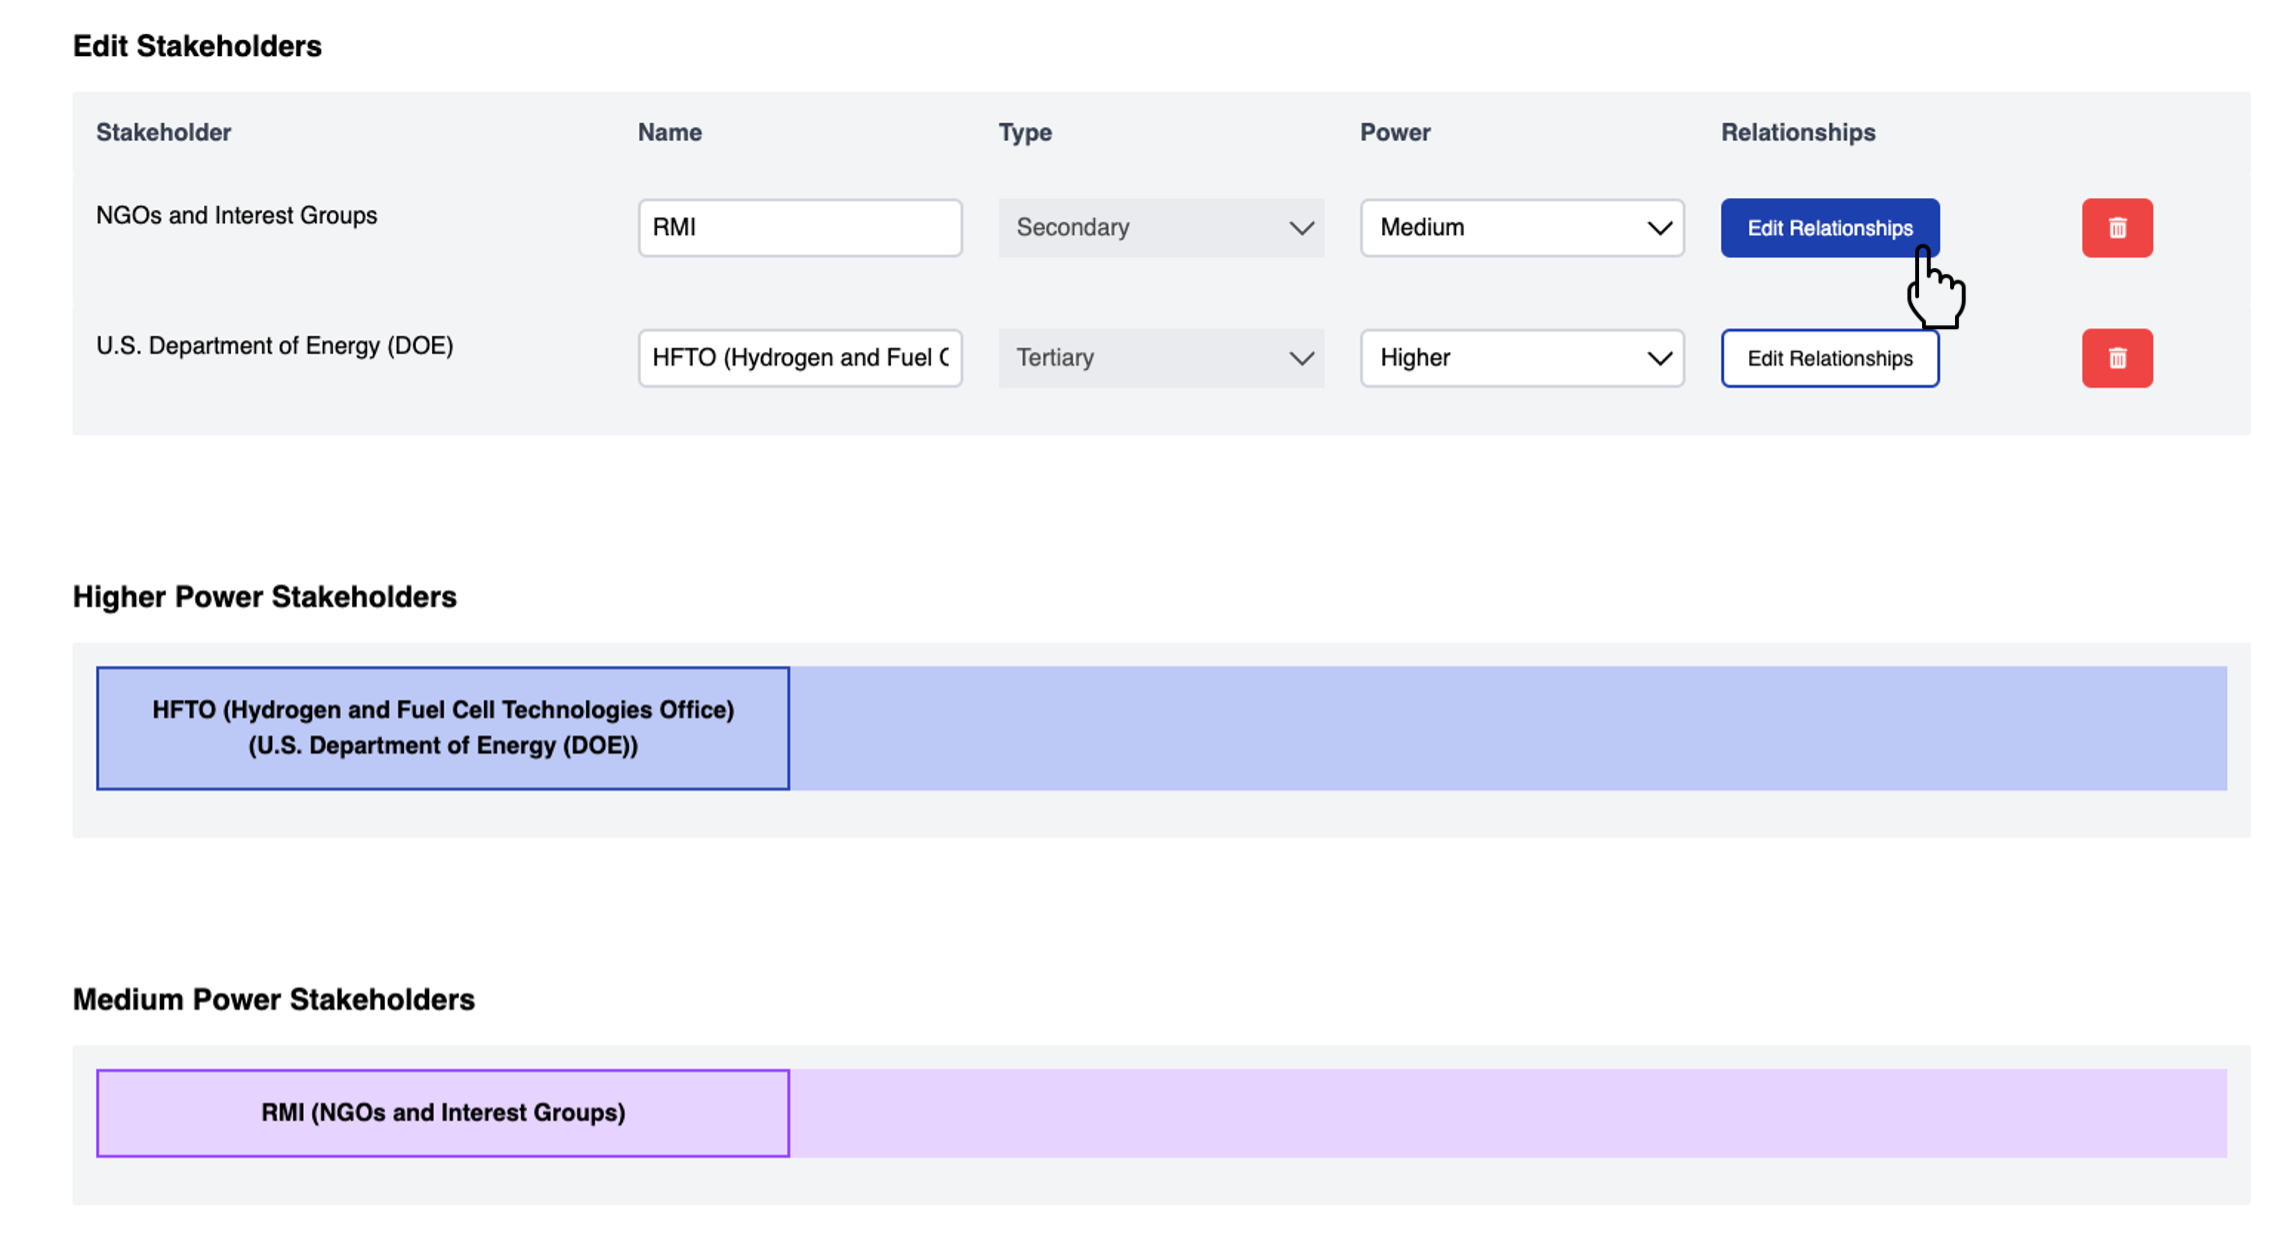
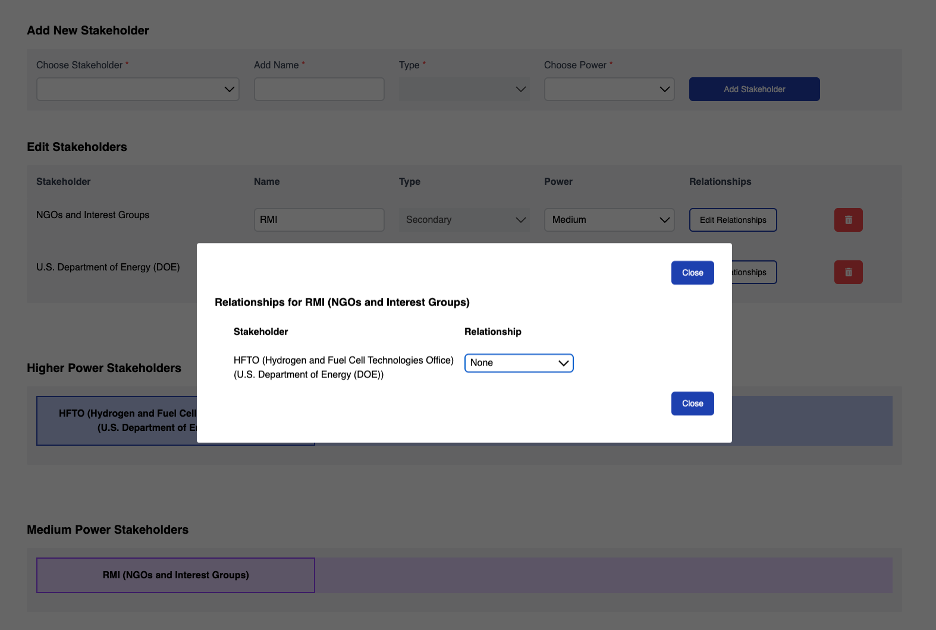
For example, after clicking on “Edit Relationships” the next screen will look like this:
STEP 5:
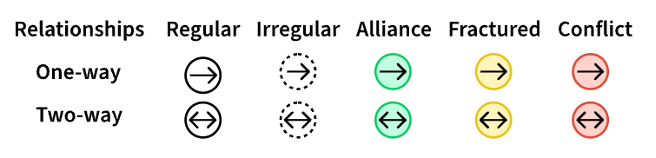
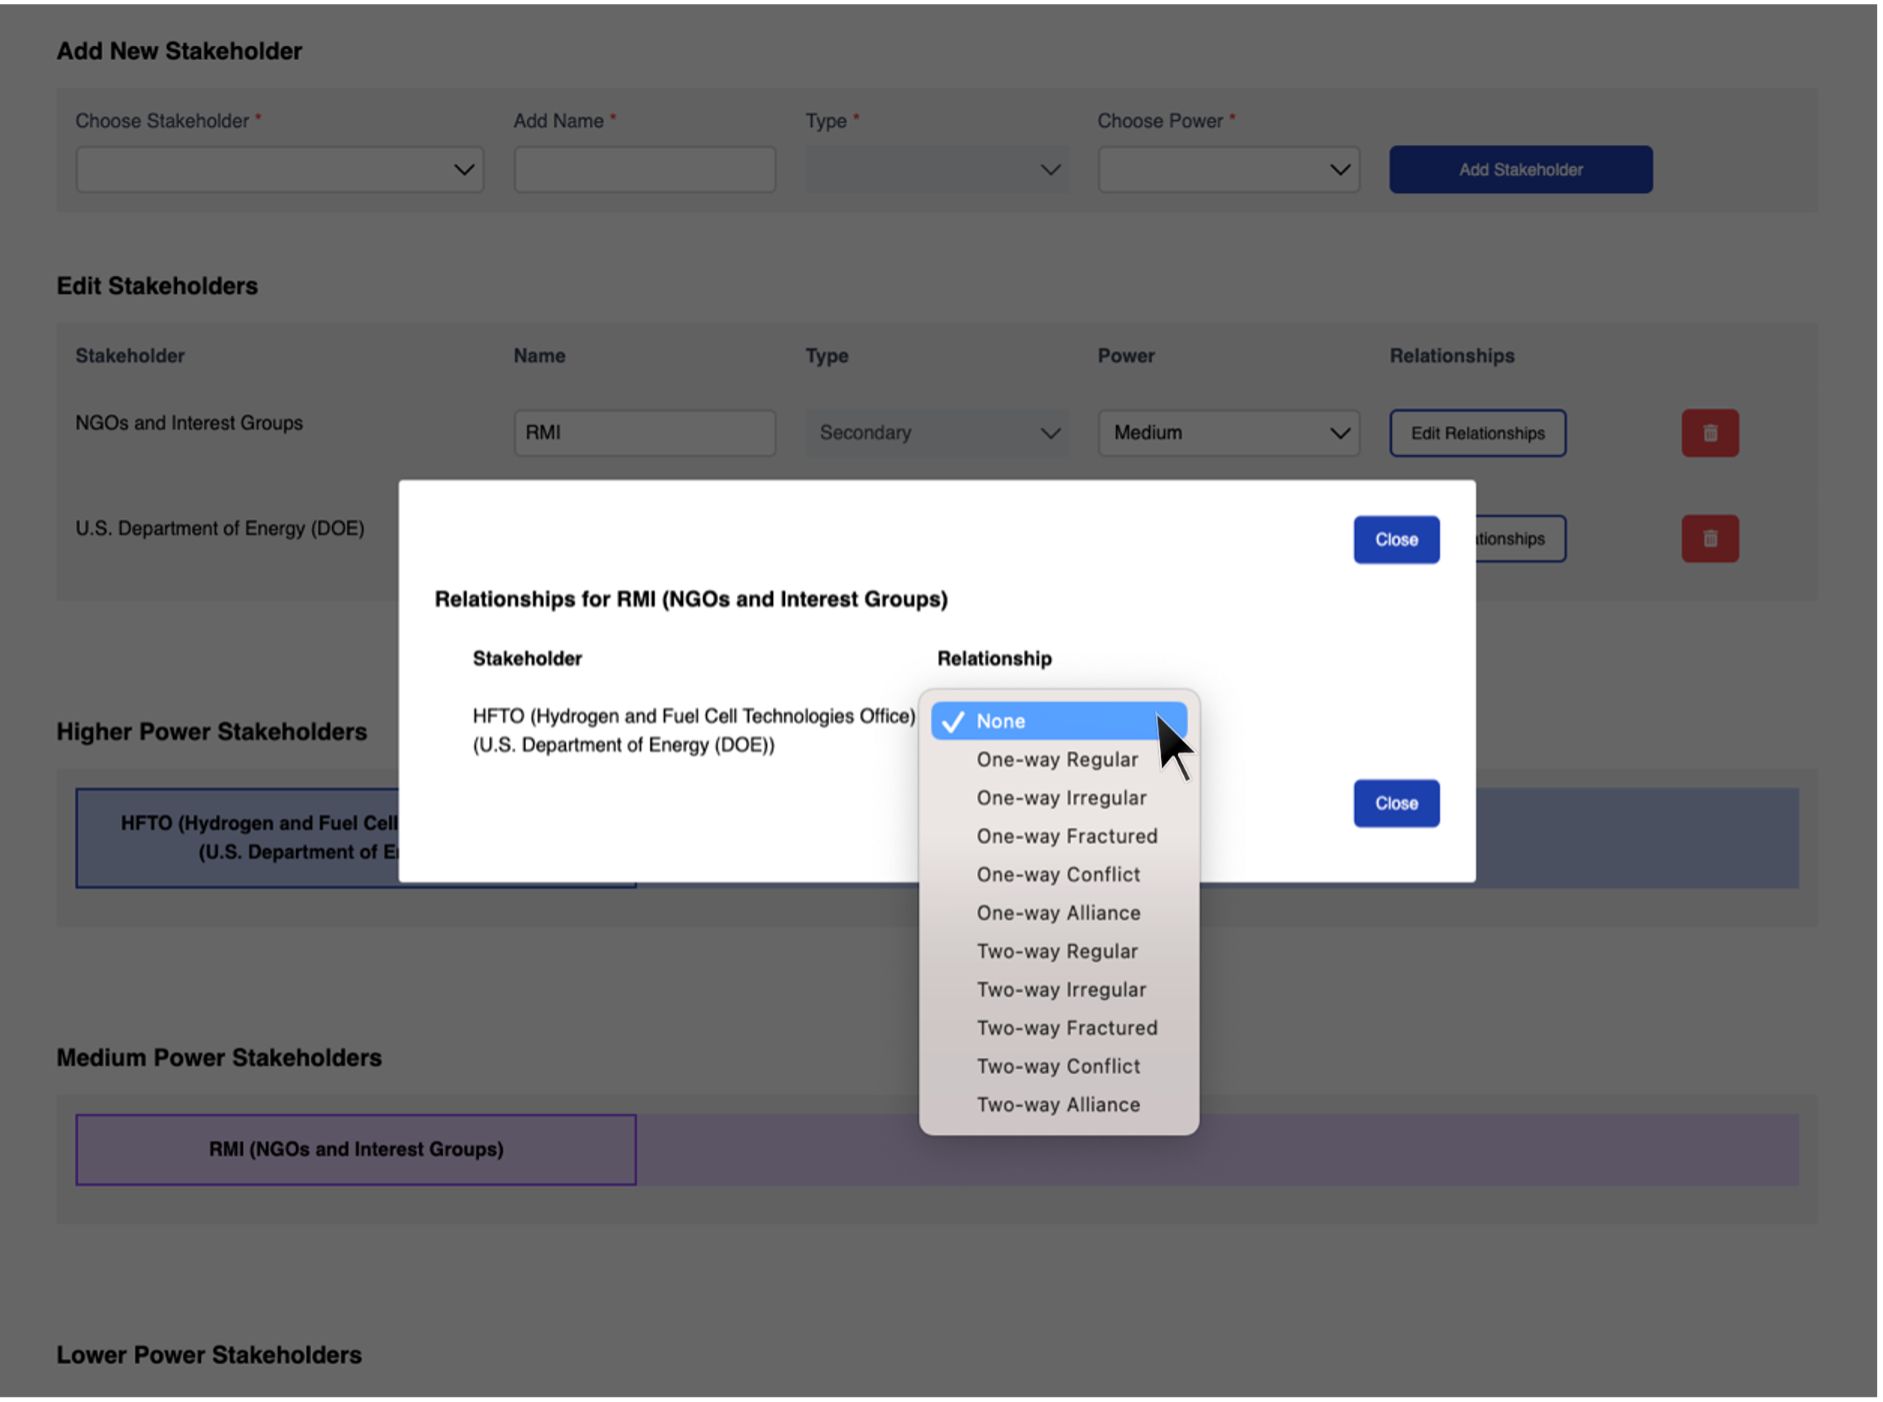
Next, click on the drop-down menu under “Relationship” and you’ll see the following options (None, One-way Regular, One-way Irregular, One-way Fractured, One-way Conflict, One-way Alliance, Two-way Regular, Two-way Irregular, Two-way Fractured, Two-way Conflict, Two-way Alliance) which will be depicted on the stakeholder mapping visualization using one of these symbols below:
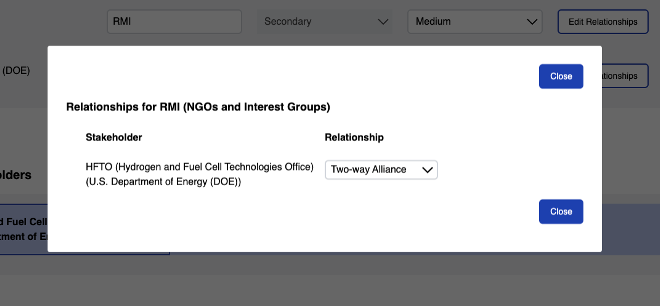
For example, clicking on the drop-down menu next to “HFTO (Hydrogen and Fuel Cell Technologies Office)” displays the various types of potential interrelationships:
For example, selecting “Two-Alliance,” as the “Relationship” between “RMI” and “HFTO (Hydrogen and Fuel Cell Technologies Office), U.S. Department of Energy (DOE)” and clicking on the “Close” button yields the following results:
STEP 6:
Repeat Steps 1 through 5 for all the rest of the stakeholders you’ve identified to date, analyzing and mapping the interrelationships for each stakeholder one by one.
For example, for a hypothetical clean energy project, the stakeholder analysis and visualization for multiple stakeholders could look like this:
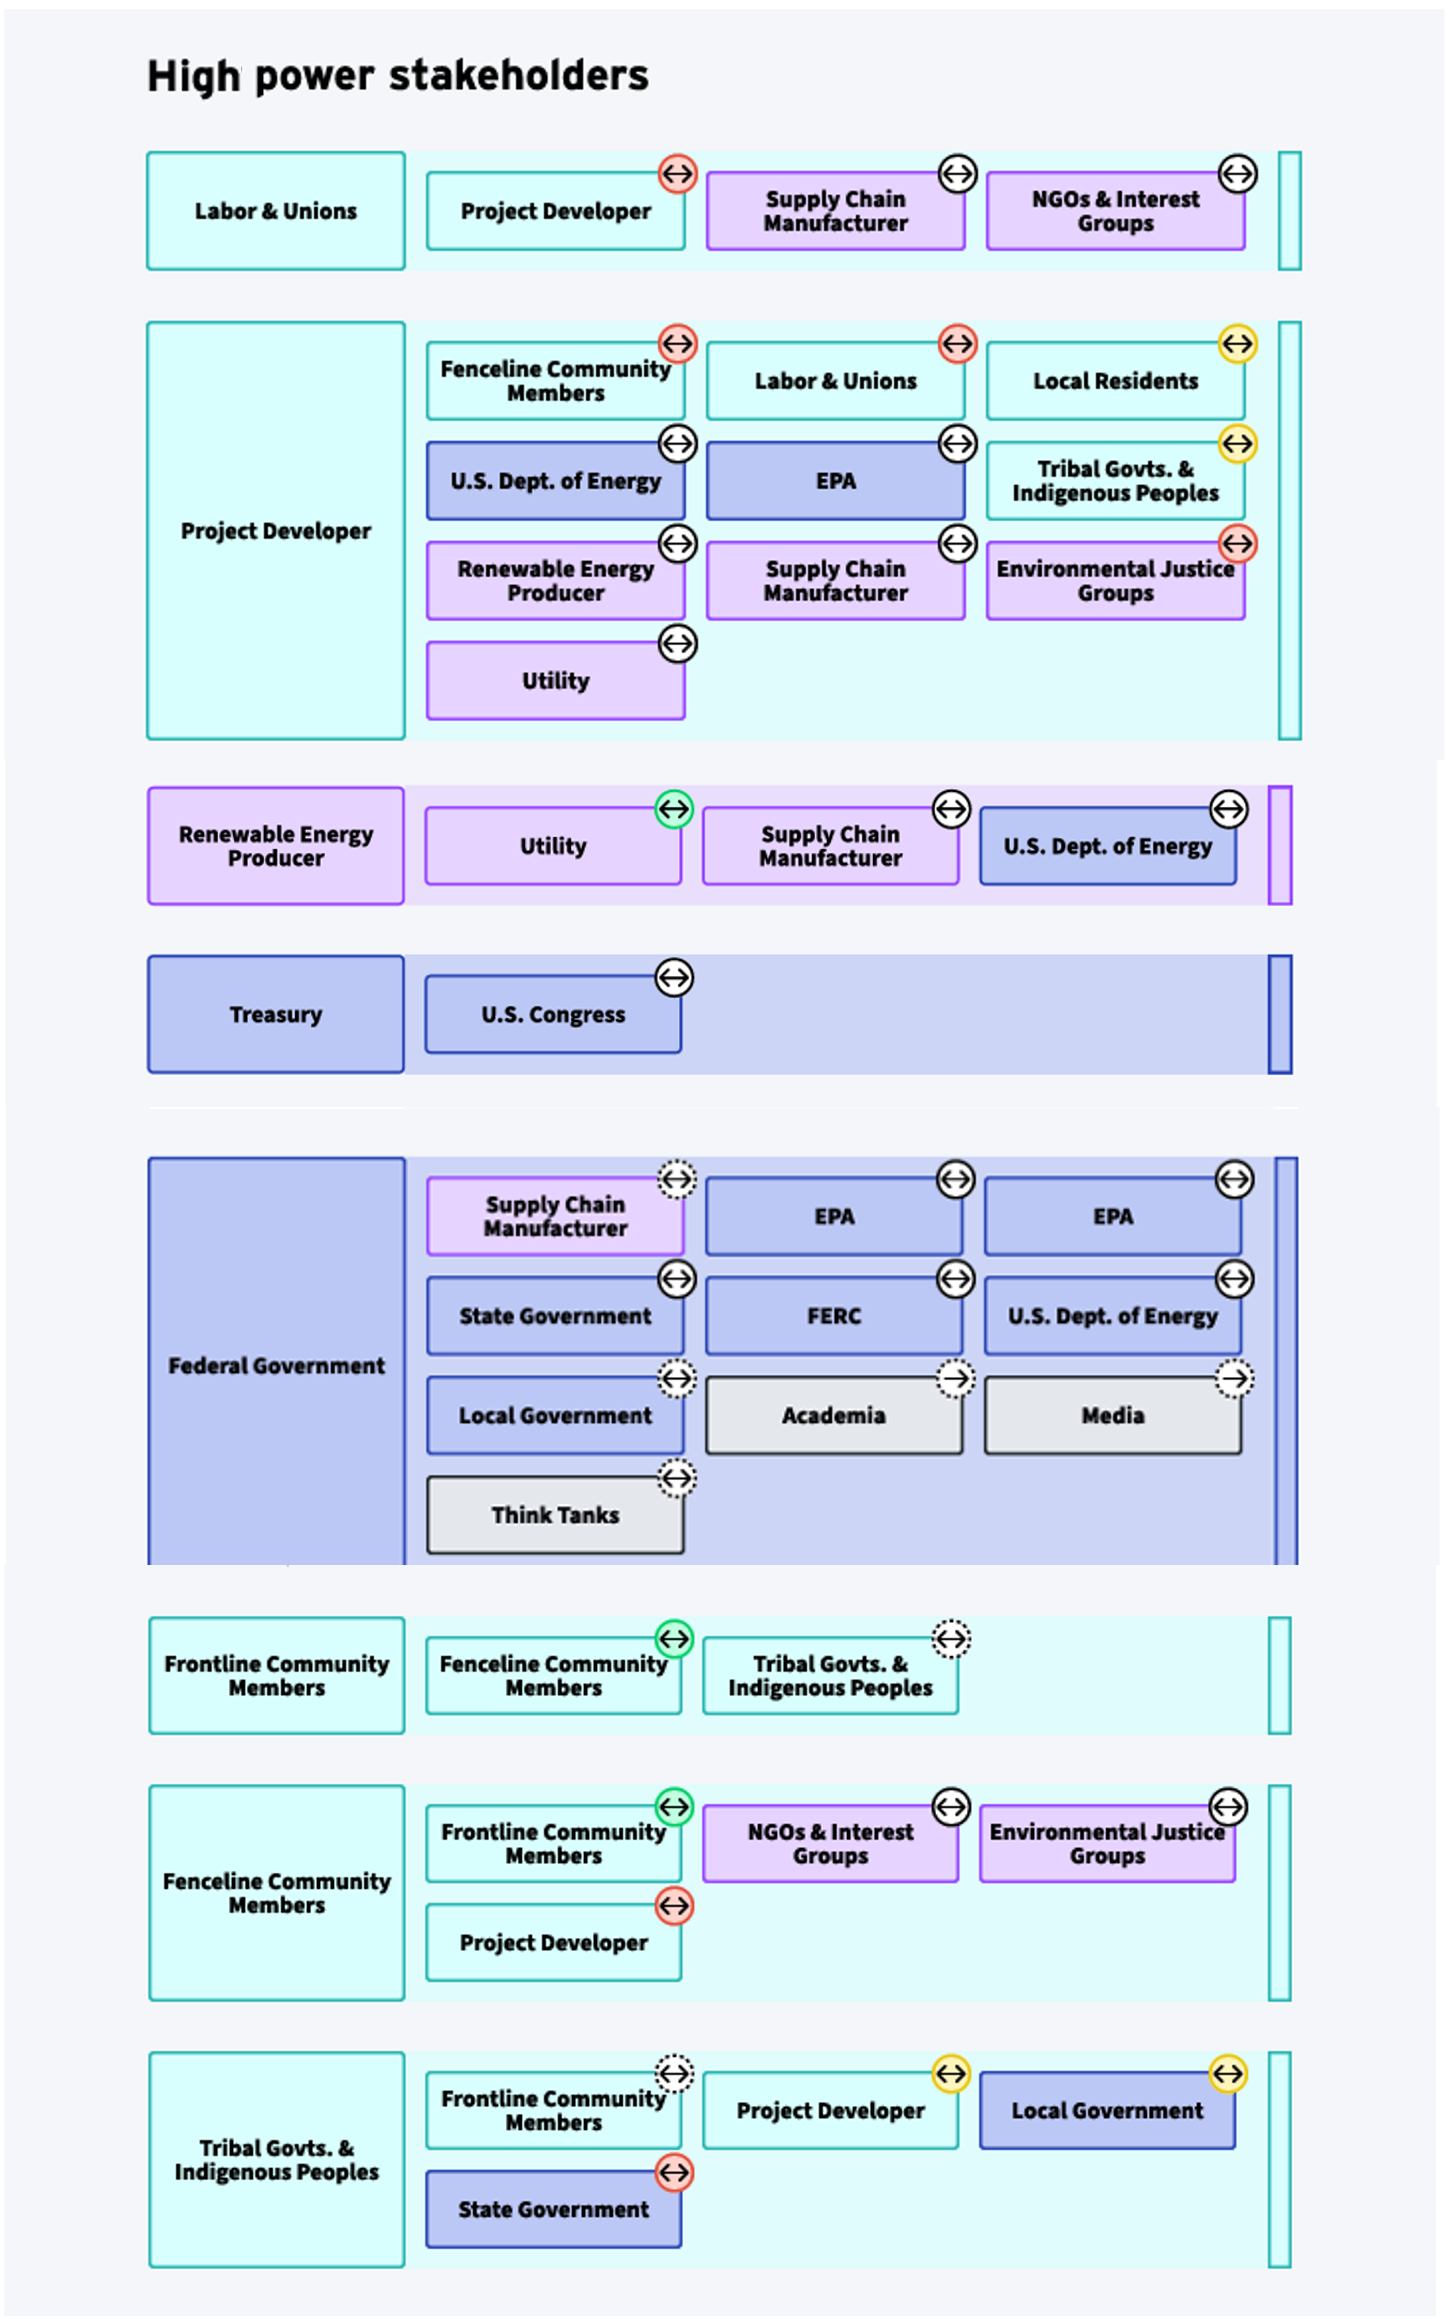
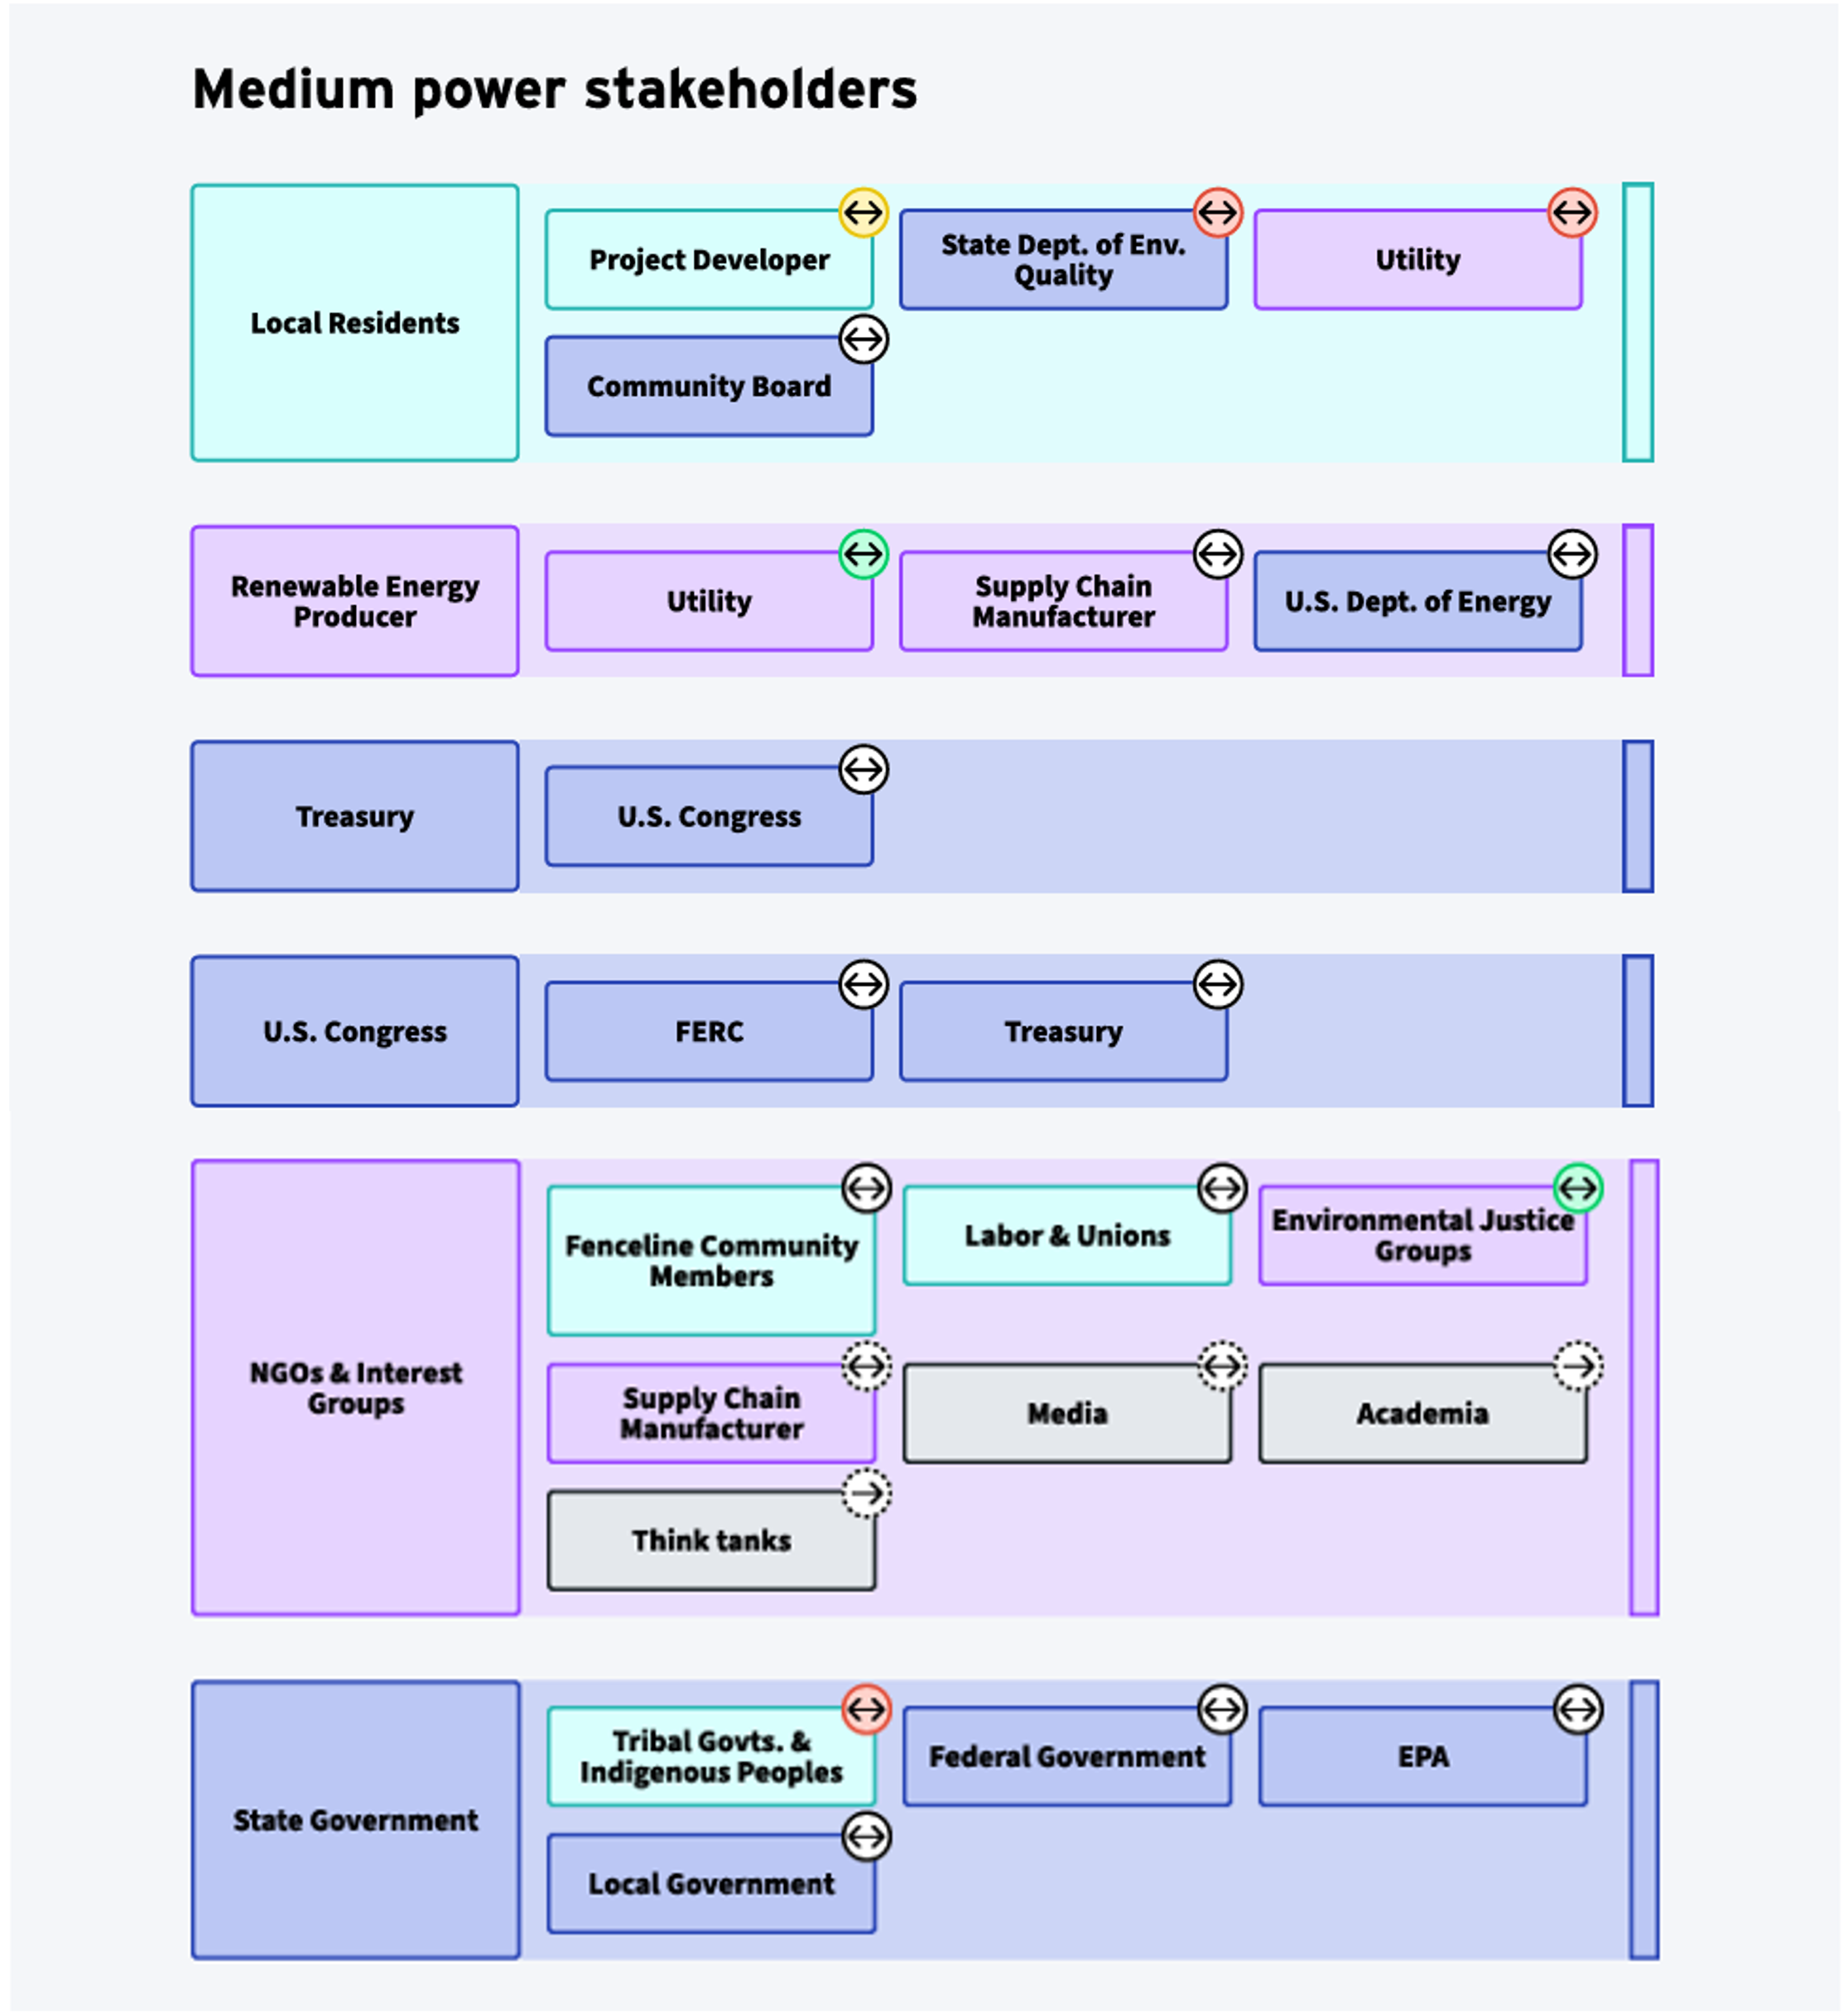
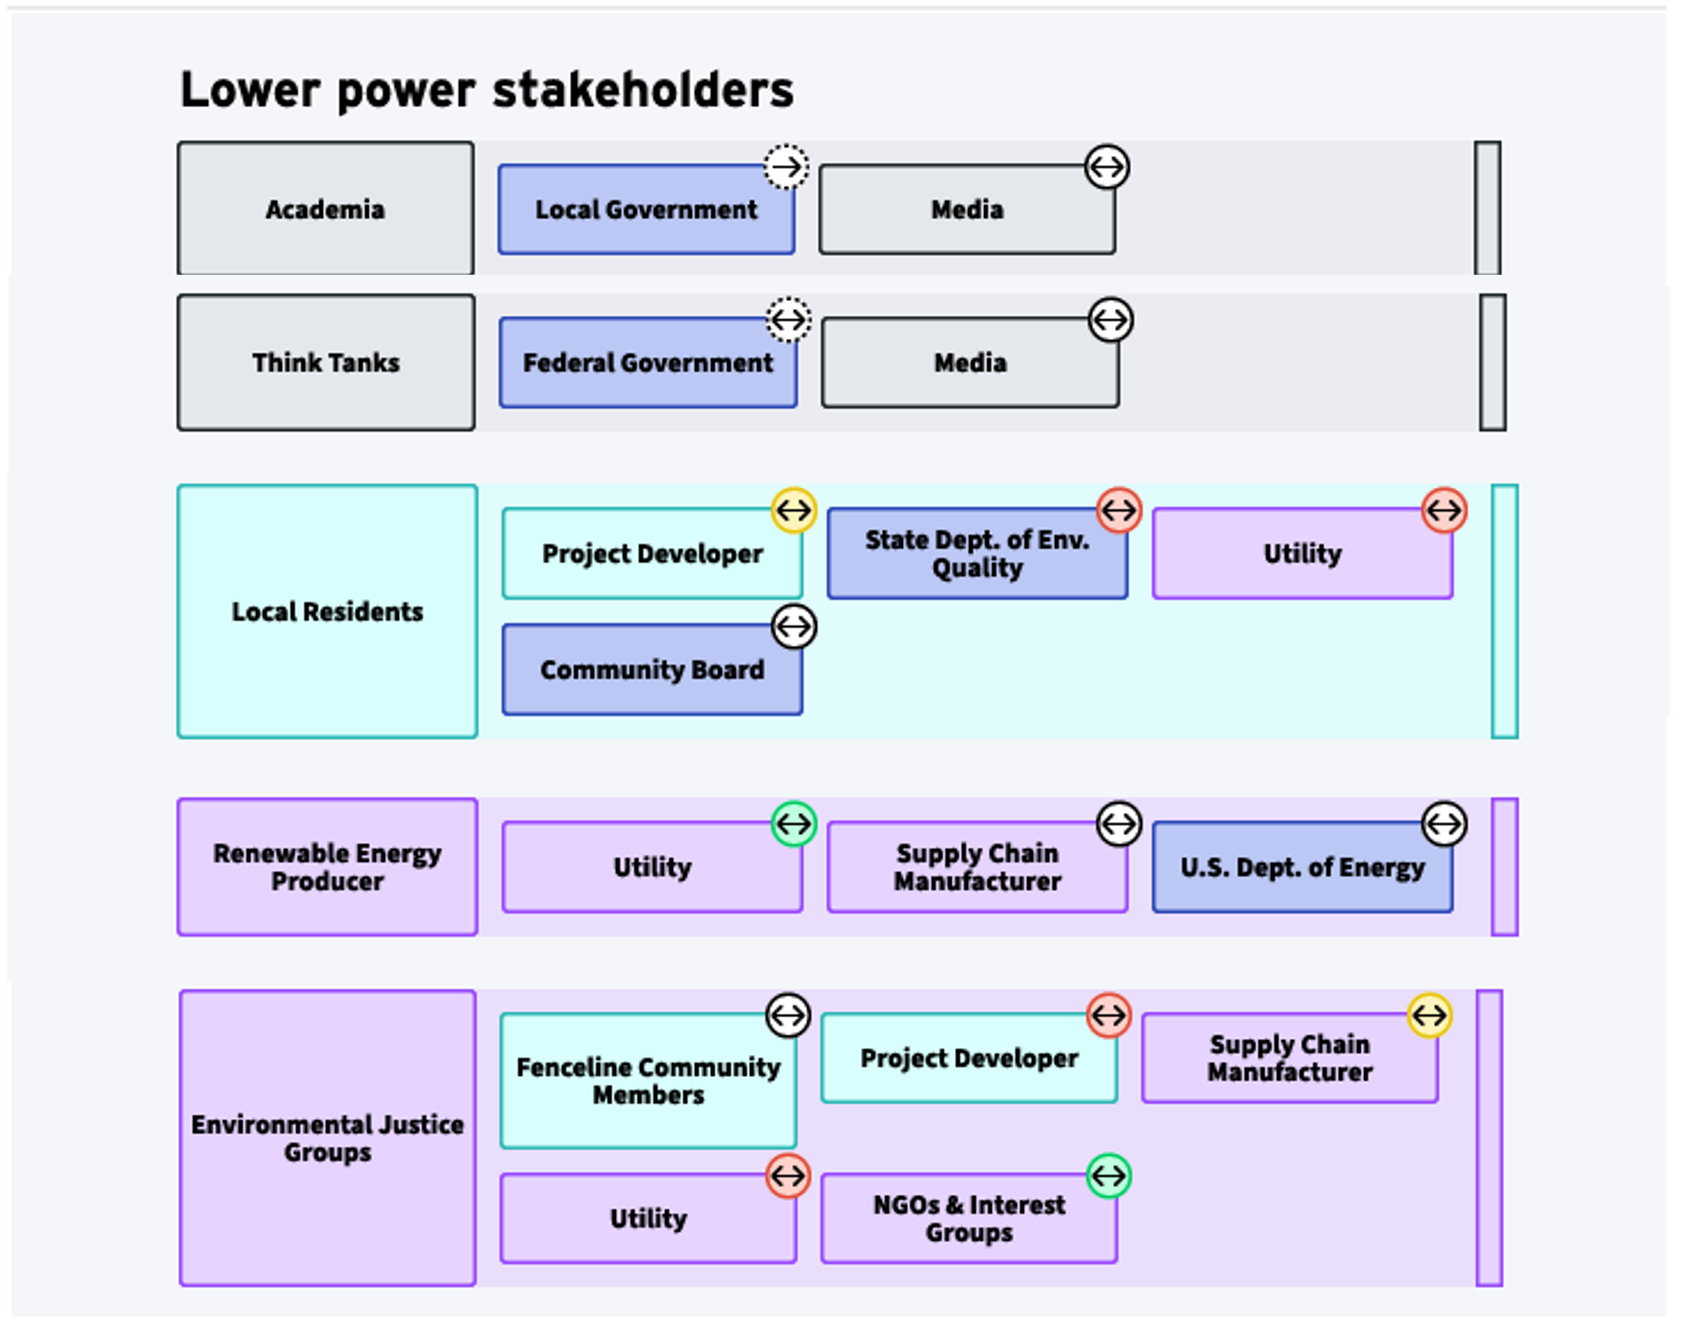
STEP 7:
Don’t forget to save a PDF of your visualization by clicking on the “Download Screenshot,” button at the bottom right of the screen!
Happy mapping!
For FAQs about S.A.M. please visit the FAQs page.
For sharing your feedback and/or troubleshooting requests for S.A.M. please email (including any screenshots): hadia.sheerazi@rmi.org.